
Leveraging the Wisdom of Menino to Design Equitable Districts for Boston City Council: The Rivera Consulting Approach
When the Boston City Council last took up redistricting after the 2010 census, Mayor Tom Menino vetoed two maps for “packing” voters of color into District 4 and weakening their voting power. According to the Dorchester Reporter, Menino wrote at the time that “My concern about the last plan was that it concentrated our many citizens of color into too few districts, and in doing so may limit their equal opportunity to elect candidates of their choice” and that “this overconcentration was especially true in District 4.” The final map passed by the council that year largely aligned with the previous decade’s map, and has been used since.
Much has changed in Boston politics since 2012. Where there were previously four councilors of color on the thirteen-member body, there are now seven. While Ayanna Pressley was the only woman serving on the 2012 council that enacted the current map, eight current councilors are women. After passing the council, the map will come before Mayor Michelle Wu, the first woman and the first person of color elected to serve as Mayor of Boston.
But so far, the conversation has touched on many of the same issues as in 2012—councilors have raised packing concerns about District 4 and proposed three maps that preserve the basic structure of the City Council districts from the past several decades. Despite the dramatic shift in the demographics and ideology of the council and its increasing focus on racial equity, no proposed maps have sought to substantially alter the demographic breakdown of the map.
Any redistricting process must balance competing values and interests. In Boston, some of these interests are established in the City Charter—according to the charter, districts should be compact, should preserve existing neighborhoods where possible, and should not divide precincts, and each district should include a near-equal population. Some are prescribed by the Voting Rights Act—places with racially polarized voting are required to draw districts in which voters of color have an opportunity to elect their candidates of choice, and as past Rivera Consulting analysis has shown, voting in Boston is racially polarized. Some priorities are outlined by elected officials, such as encouraging competitive elections.
The central question facing map-makers is how to split up Dorchester between Districts 3 —which is currently represented by Councilor Frank Baker— and 4 —represented by Councilor Brian Worrell. Together, the majority-Dorchester precincts of the city include 121,305 residents, according to Rivera Consulting’s analysis of census data. Since this number far exceeds the council’s target district size of 75,072 residents, any map that is drawn will necessarily split Dorchester into two or more districts. For the past several redistricting cycles, the council has drawn the line between these two districts running north-south, putting the eastern half into District 3 and the western half into District 4.
All three maps proposed by Boston City Councilors largely maintain this split. This analysis compares those maps to the existing map according to their overall effect on the power of voters of color to elect preferred candidates, then recommends an alternative map based on a district line that runs east to west.
Methodology
This analysis uses two approaches to analyzing the demographic composition of districts on proposed maps. The first approach considers the demographics of all residents using districtr. These numbers count every resident equally in determining a district’s racial makeup, regardless of their eligibility to vote. Districtr renderings of each Councilor’s proposed districts are available here:
The second approach weights precinct-level demographics by the percent of residents of a given precinct who were registered to vote as of September 2022 before aggregating these precinct-level estimates to a district level. While these numbers are an imperfect substitute for precinct-level Citizen Voting Age Population numbers, they allow calculations to better approximate the eligible electorate in a given district.
The Current Districts
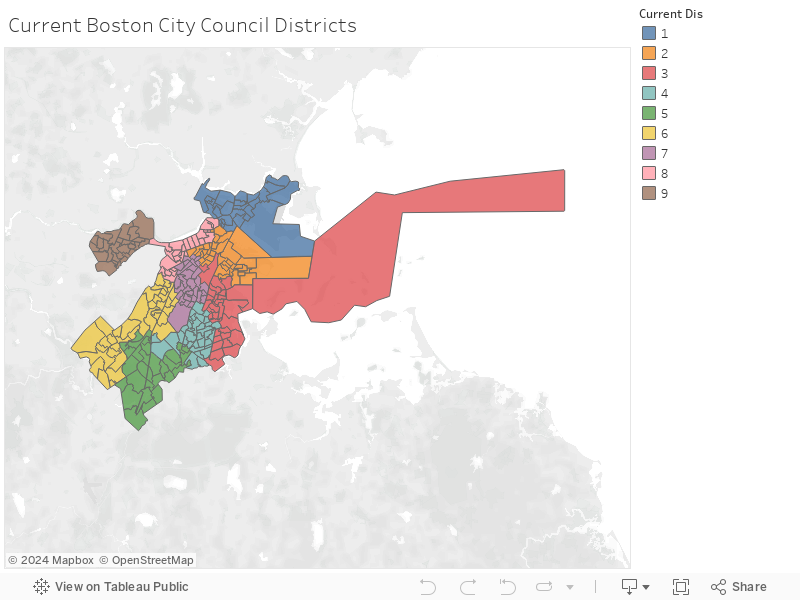
The map above shows an approximation of current city council districts redrawn with the city’s new precincts, while the chart below shows the share of residents who are people of color in each district. City Councilors do not have the option of maintaining this map exactly because population growth in District 2 requires them to redraw the lines, but it is worth considering the current system of districts as a baseline.
Current districts (approximated using redrawn precincts) listed by the share of residents who are people of color
As shown, the current map creates three districts where more than 70% of residents are people of color, all of which are currently represented by councilors of color. It creates an additional district where a majority of residents are people of color, which is currently represented by Frank Baker.
Designing maps that maximize the voting power of people of color requires avoiding both “packing” and “cracking.” “Packing” is when maps create districts where the overwhelming majority of voters are people of color and thereby reduces the number of residents of color in other districts, while “cracking” splits communities of color into many districts to dilute voting power in any one district.
Districts 4 (represented by Councilor Worrell) and 7 (represented by Councilor Fernandes Anderson) have the highest estimated share of registered voters are people of color and raise packing concerns. Since the last redistricting cycle after the 2010 census, every finalist in every city council election held in each district has been a person of color. There is already virtually no chance of a candidate winning either district without majority support from Black and Latino residents, and increasing the share of residents who are Black and Latino in these districts reduces the overall citywide voting power of Black and Latino residents.
The source of this packing concern is the line between Districts 3 and 4—while the majority of residents of both District 3 and District 4 are people of color, District 3 has consistently been represented by white councilors, partly because it includes Precinct 16-12, the consistent highest-turnout precinct in the city and one of its most conservative. Maintaining District 4 lines where more than 90% of residents are people of color means maintaining District 3 lines where white residents are roughly 40% of the district, and can consistently select their councilor of choice in a majority-people of color district.
Districts Proposed by City Councilors
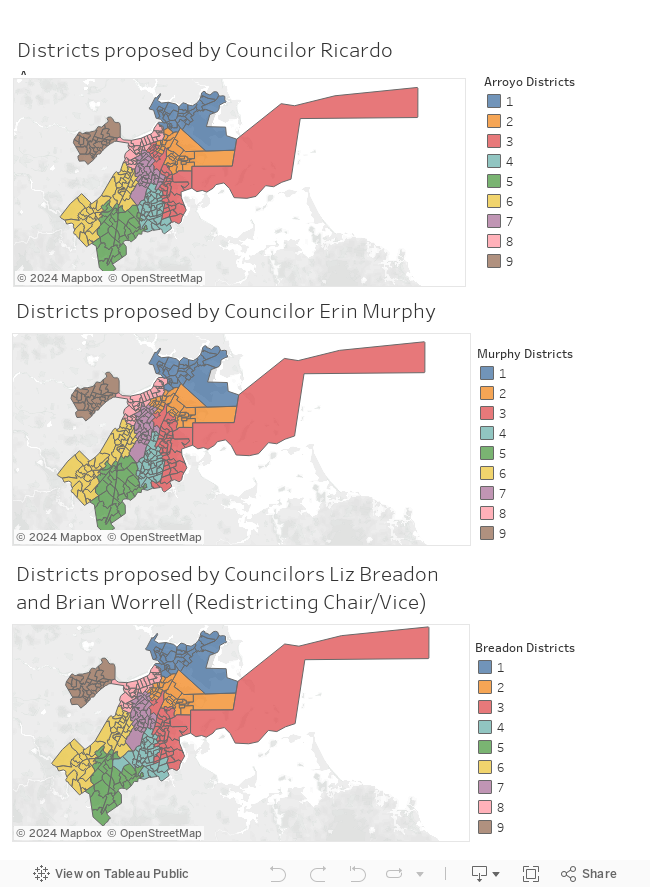
As of early October, every map proposed by one or more sitting City Councilors preserves this dynamic by drawing a north-south line splitting Districts 3 and 4. These maps are shown in the interactive above—click on a district in the legend to see it highlighted on all three maps and compare where the proposals differ. The demographics of the districts they propose are shown in the table below:
Districts proposed by City Councilors, listed by share of residents who are people of color.
The Breadon-Worrell map comes closest to drawing District 3 to increase the power of voters of color, while the Arroyo and Murphy maps add more voters of color to Districts 7 and 4, respectively. All three maps, though, still preserve the north-south split between Districts 3 and 4, and all yield a similar result, with only three districts where voters of color can consistently elect their preferred candidates. This means that while more than half of Boston residents are people of color, only one-third of districts are structured to allow voters of color to elect a candidate of their own preference.
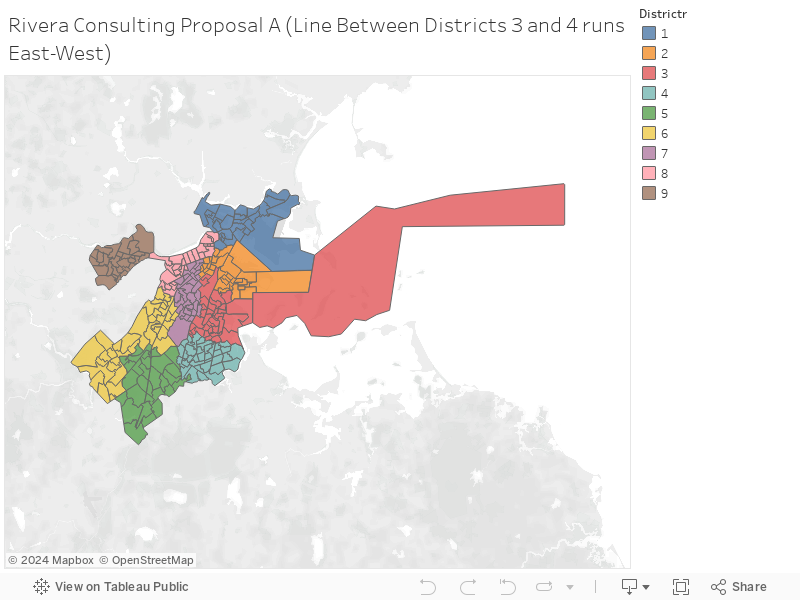
The Rivera Consulting Map
Following the wisdom of Menino, our recommendation in drawing these districts more equitably does not require a wholesale reimagination of the council map—it simply requires changing the geographic orientation of the Dorchester split that is inherent to any council map. The following map amends the boundaries of these districts, shrinks District 2 and expands District 7 in the South End to achieve equal population, redraws the line between Districts 4 and 5 between Mattapan and Hyde Park as recommended by both Councilor Murphy and Councilor Arroyo, and makes no other changes.
This map yields the following demographic composition:
Potential districts drawn by Rivera Consulting, listed by share of residents who are people of color.
This map includes 4 districts where between 70% and 80% of residents are people of color, according to either the total population or the weighted estimate based on precinct-level voter registration. This range allows for robust multi-candidate races with multiple candidates of color—for example, it roughly mirrors the demographics of the Second Suffolk Senate district, where all five candidates in the recent race were Black. Unlike the current map, though, it does not “pack” voters of color into districts to the degree that it minimizes the voting power of communities of color. It does not split any additional neighborhoods compared to the current map, and does not make elections any less competitive, respecting other priorities laid out by councilors. This map represents an approach to making the overall council map more racially equitable, giving communities of color more opportunity to elect candidates of their choices for the next ten years. Its main departure from the priorities outlined by councilors is that it differs meaningfully from the status quo.
Conclusion
There is clear political context for this focus on the status quo—in order to pass, maps must win support from the very councilors who will run on them next year. But council districts are about far more than the next election—it's about the future of city residents to live in a city that is affordable and prosperous that is accessible to all, especially renters, families, and low to moderate income residents. While the status quo bias of incumbent officials toward maintaining existing systems is particularly acute in redistricting—where the elected officials who draw the maps depend on them for their jobs—we see similar dynamics across our equity research, planning, and engagement work. The majority support of the status quo locally and across the Commonwealth continues to create paint points and barriers to equity, where the trade off for advancing racial equity is the “loss” of power and influence. In determining how to split Dorchester, the Council faces a clear distillation of this now common false binary: depart from the status quo to enhance racial equity or preserve the status quo.